Dashboard – Anesthesia
Show when an Anesthesiologist has an overlapping operation. Show the details on how many operations are overlapping, And the date and times of the overlapping operations.
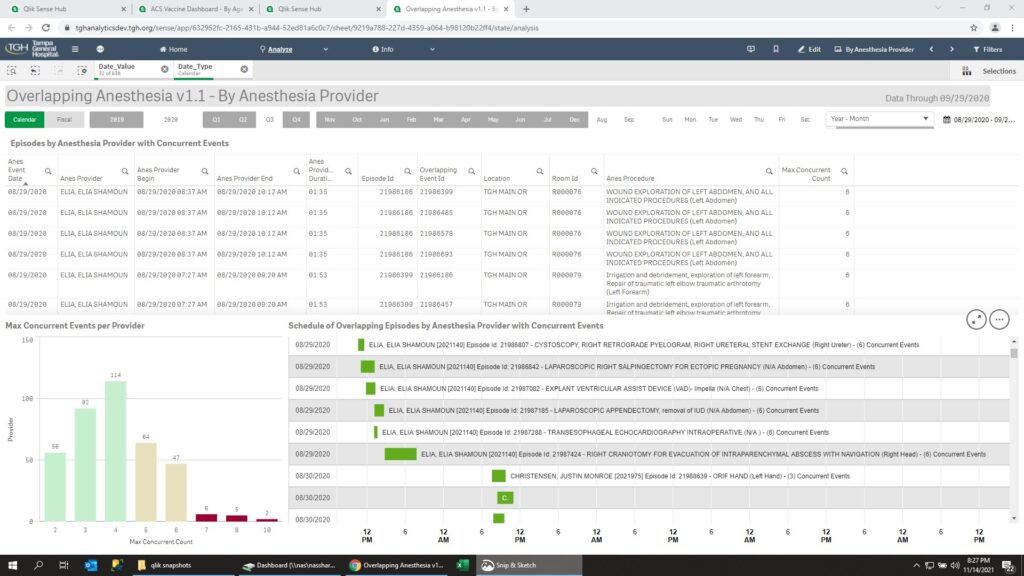
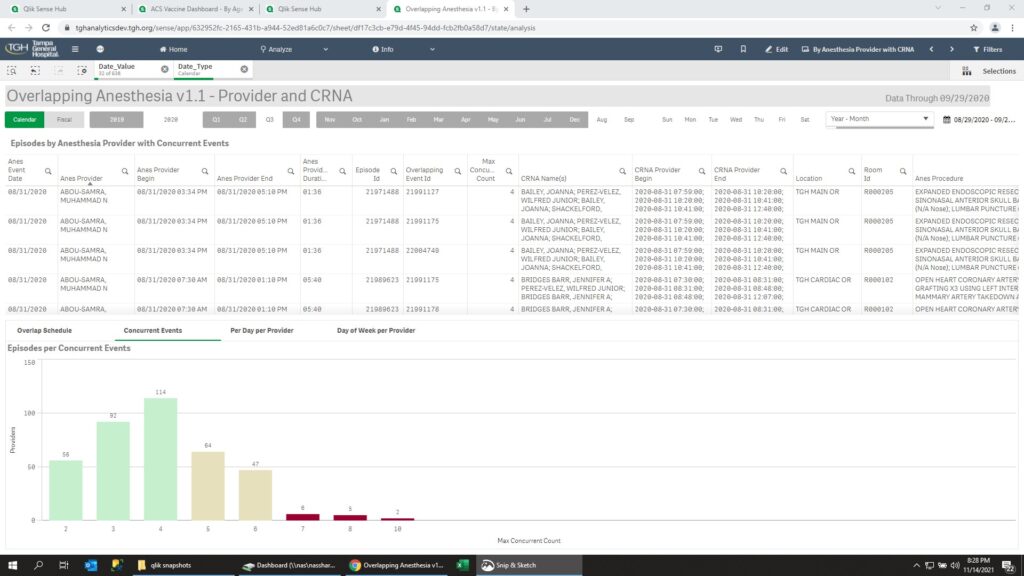
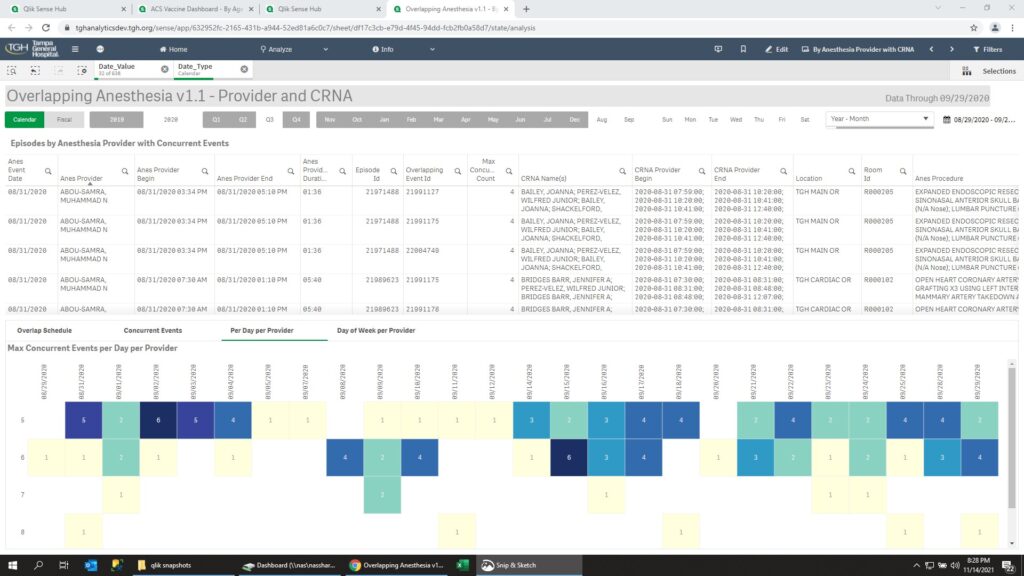
Show when an Anesthesiologist has an overlapping operation. Show the details on how many operations are overlapping, And the date and times of the overlapping operations.
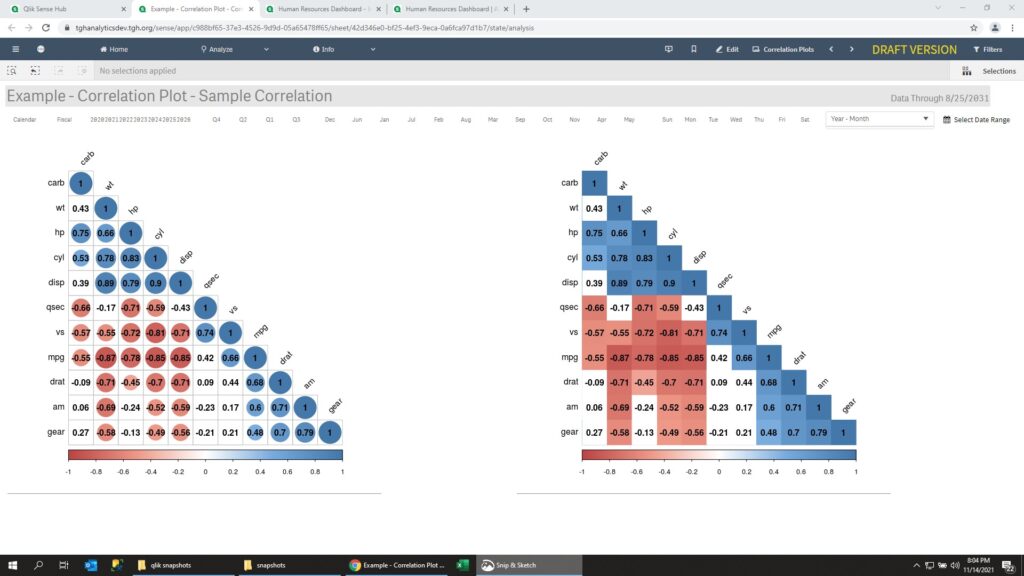
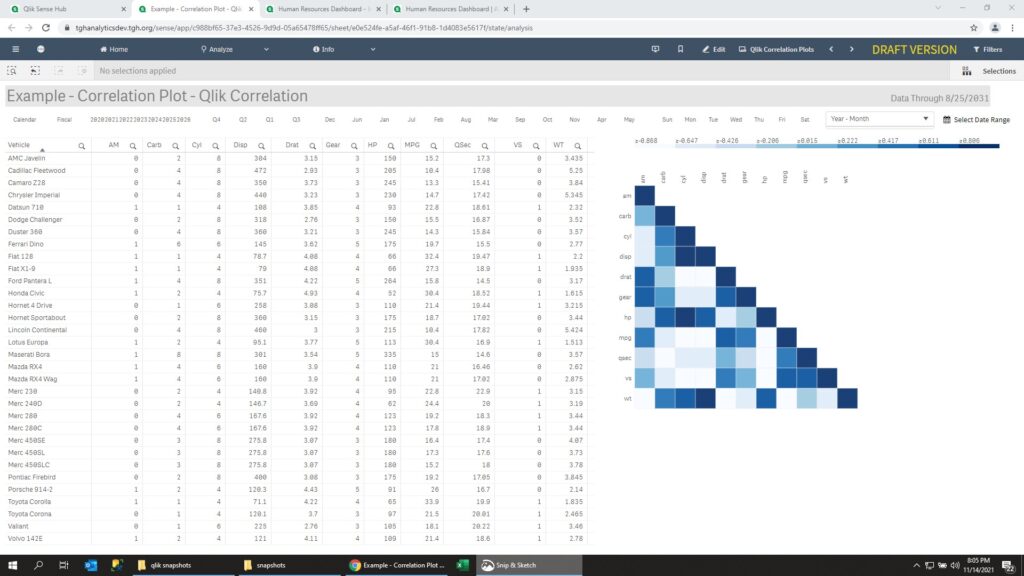
Qlik Sense does not have a correlation chart built-in. However we can mimic the capability by using a heat map.
Powered by WordPress & Theme by Anders Norén