Blazin’ Burger Business Performance Metrics
Over the last year, the three New York locations of fast-food restaurant Blazin’ Burger have
produced mixed financial results.
Below is a presentation-ready dashboard that will show
- KPI’s that show performance data from each location
- External data from NYC board of health
Below are dashboards created using MicroStrategy.
Dashboard KPI’s show the following:
The top chart shows the plotting of the daily revenue, bottom left is a heat map of average order count, and bottom right correlation between order and item counts.
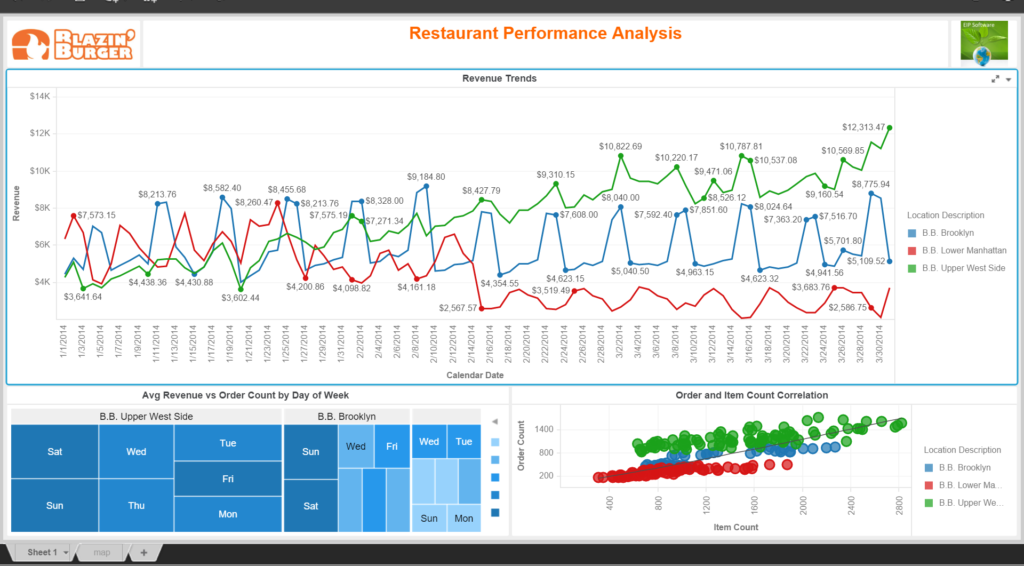
Plotting of the daily revenue shows consistency; especially considering the same day of the week, i.e. revenue for each Monday were similar. The exception was the lower Manhattan location where in beginning of February the revenue started to plummet.
The heat map shows the average order count by the average revenue for each location based on the day of the week for the specified time period. The lower Manhattan location has the lowest order count and least amount of revenue; indicated by light blue.
Next looking at the correlation between order and item counts, we can see confirmation that the lower Manhattan location is clustered at the lower rate than the the other two locations. The over all trend line is about a 45 degree line. The upper West Side location trends significantly higher than the lower Manhattan location.
NYC Public Health External Data
Left figure shows the NYC health inspections average restaurant score by zip code, top right compares Blazin’ Burgers health inspection score against average revenue, and bottom right is average scores by cuisine type and borough.
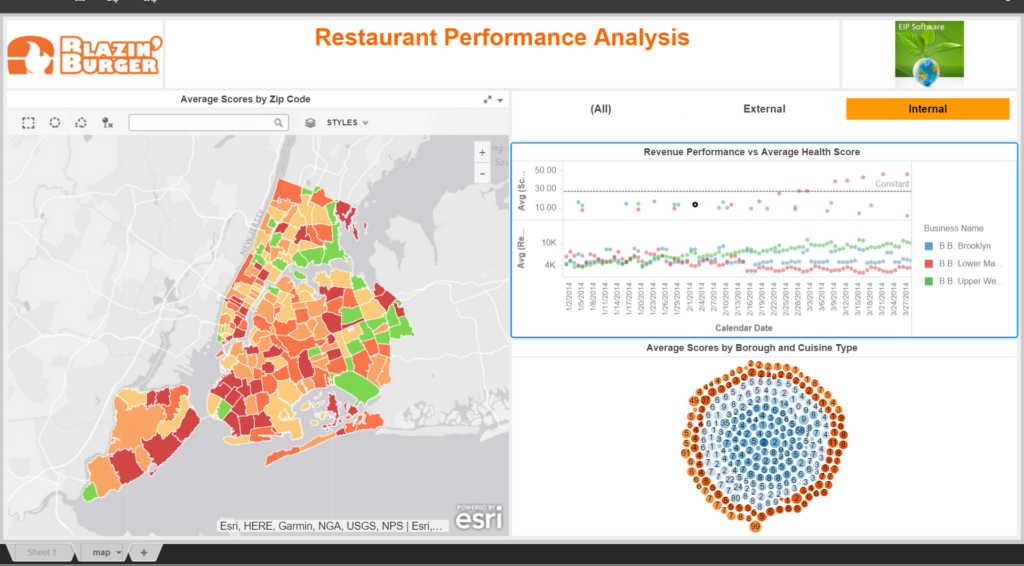
The NYC health inspections data set has the scores for each business. The score is indicative of the number of health code infractions for the location. The lower the score the lower amount of infractions. Lower scores are indicated by green; higher scores are indicated by red. The map below shows the average score by zip code. It will allow us to compare the Blazin’ Burgers locations against the average score for their location zip code.
Looking at each locations Revenue and Health Inspection score, we can see an inverse relationship. As the Lower Manhattan’s health inspection score increased, performing worse, the daily revenue decreased. It is in alignment with what was shown in first two visualizations.
Lastly looking at the average scores by Borough and Cuisine Type; we can investigate how Blazin’ Burgers is performing against similar cuisines.
Leave a Reply