Dashboard – Child Vaccinations
Dashboard showing details about vaccinations for children age 9 – 18
With focus on vaccinations for TDAP, MCV, and HPV.
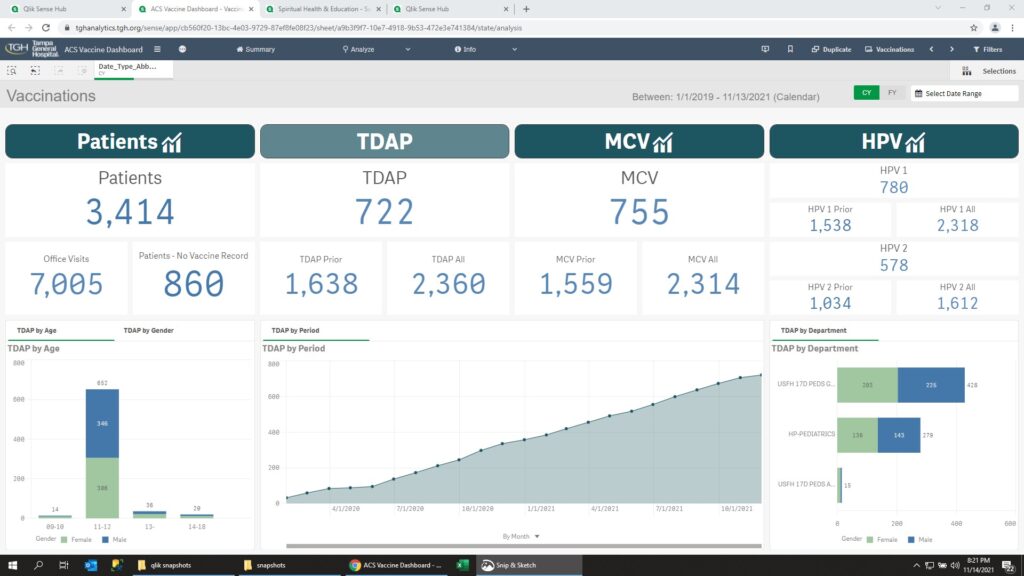
Summary
Patients between ages 9 – 18 who have received at least one of the vaccinations.

The bottom three graphs:
- Graph Bottom Left – Show Either
- Group by Age
- Group by Gender
- Graph Bottom Middle – By Month, Quarter, or Year
- Cumulative number of patients and
- Cumulative number of offices visits
- Graph Bottom Right – Number of Vaccinations
- Grouped by Office Location
TDAP Vaccine
TDAP Vaccine, updating the 3 bottom graphs
MCV Vaccine

MCV Vaccine, updating the 3 bottom graphs
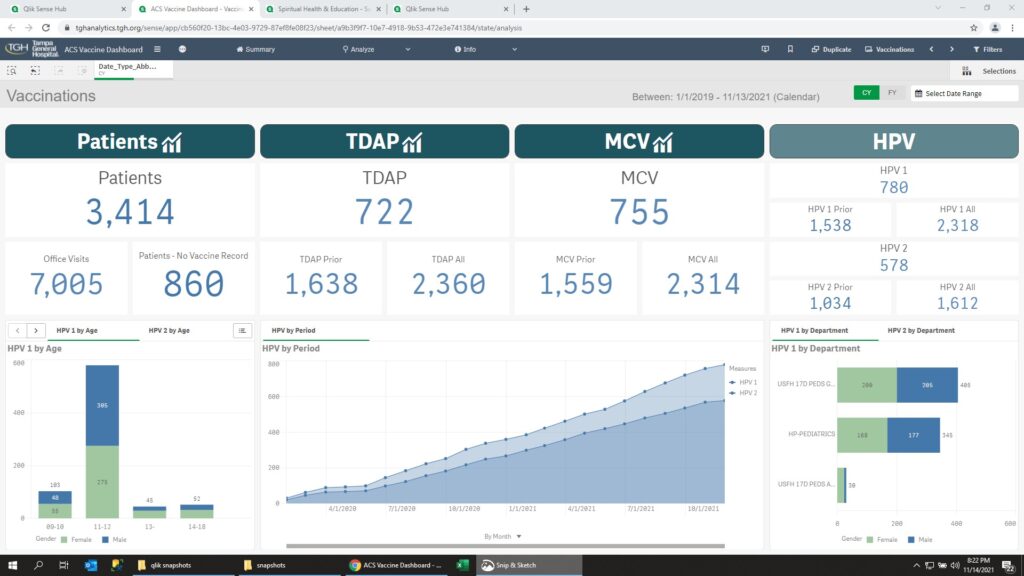
HPV Vaccine
HPV Vaccine, updating the 3 bottom graphs
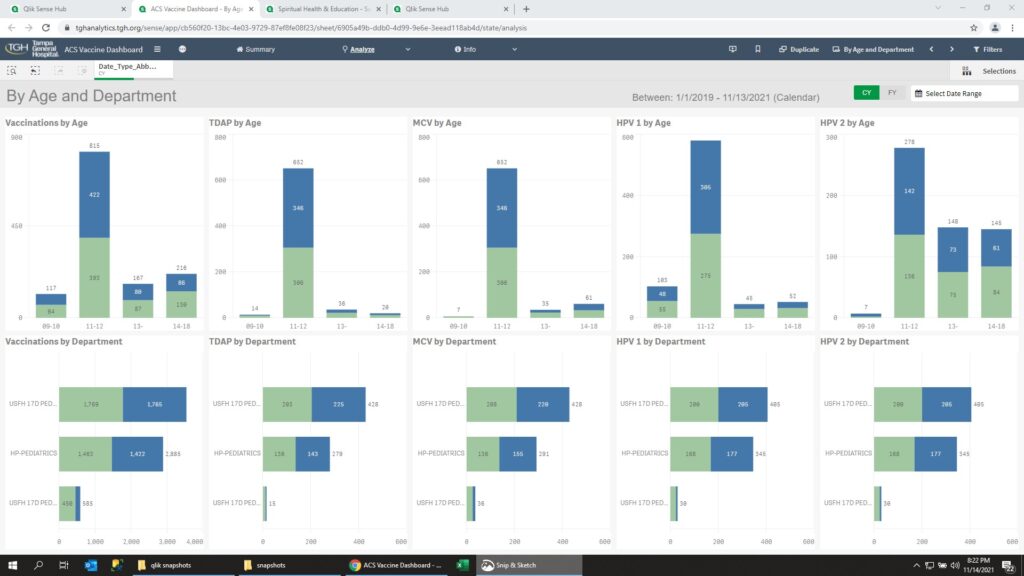
By Age
Pull together graphs to do a side by side comparison. Top four graphs show vaccinations by age, and for specific vaccination
By Period

Cumulative number of vaccinations by month
Dynamic Pivot Table

Dynamic Pivot Table, allowing for grouping by Department, Gender, Quarter End Date. The end user can turn on and off the grouping levels by the toggle buttons on the left side


KPI Definition

Simple table to show how all of the different KPI’s are calculated
Leave a Reply