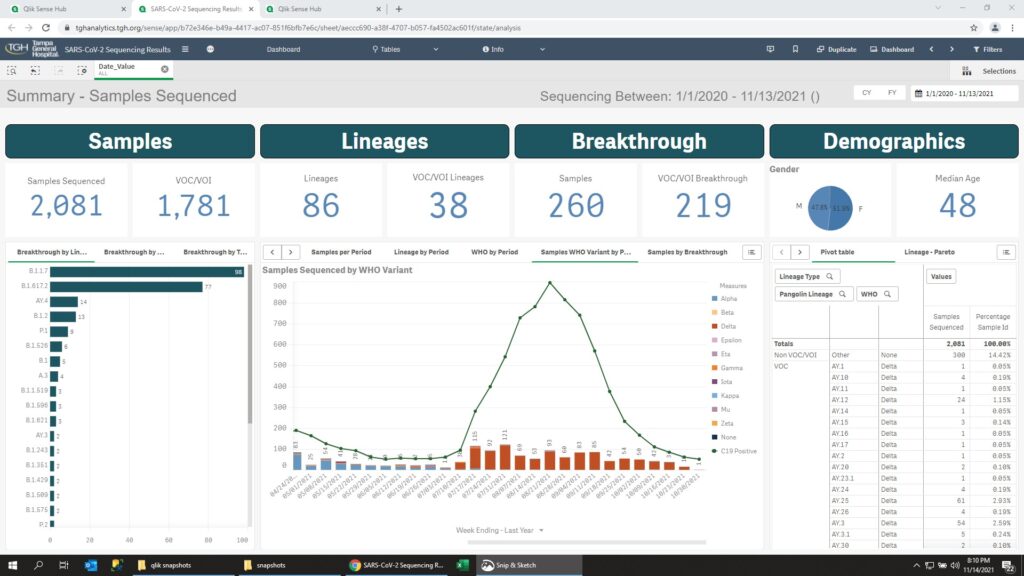
Dashboard – Covid
Tracking the Covid variant by incidents, lineage, location and patent demographics
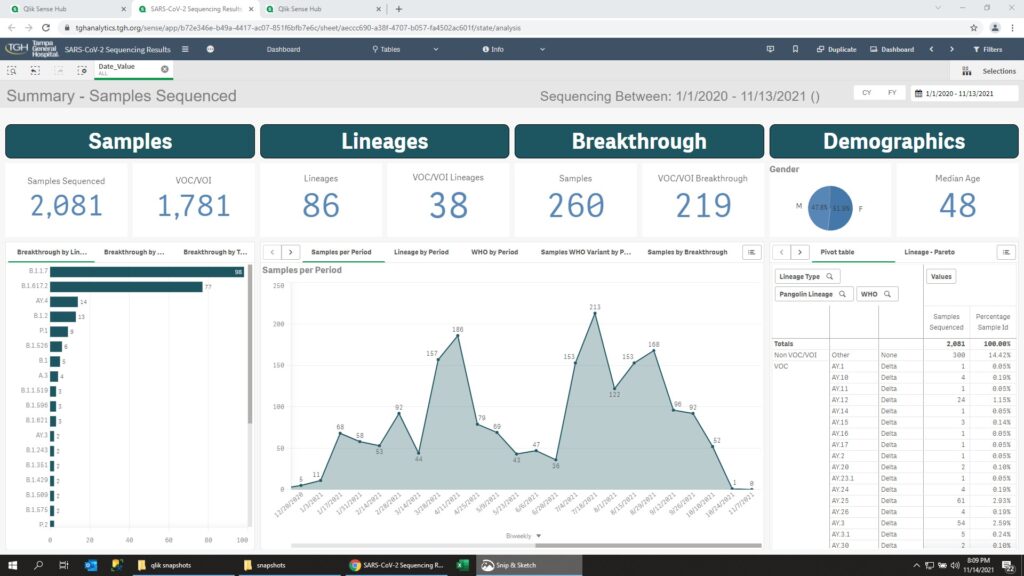
Samples
All Samples
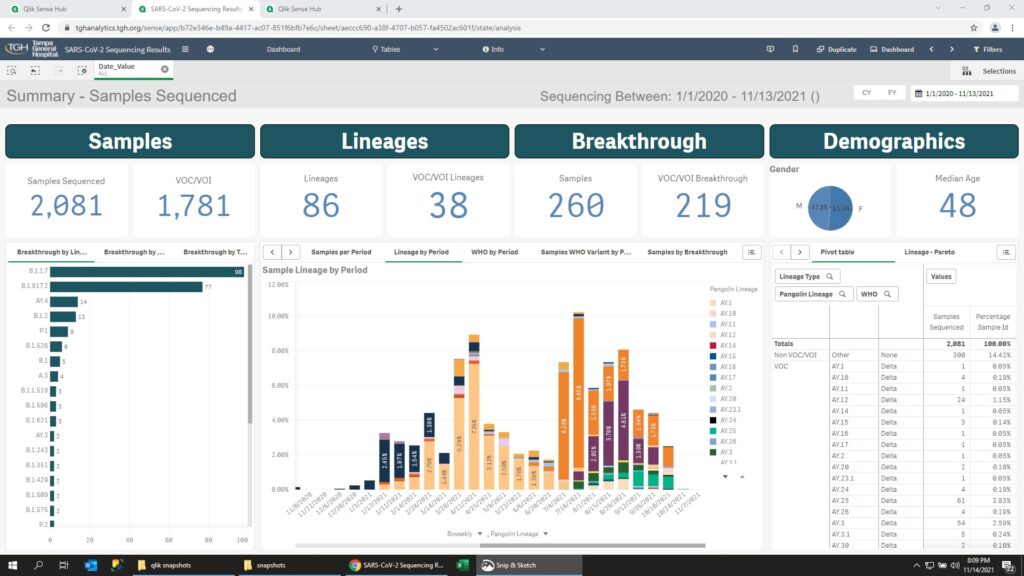
Lineage by Period
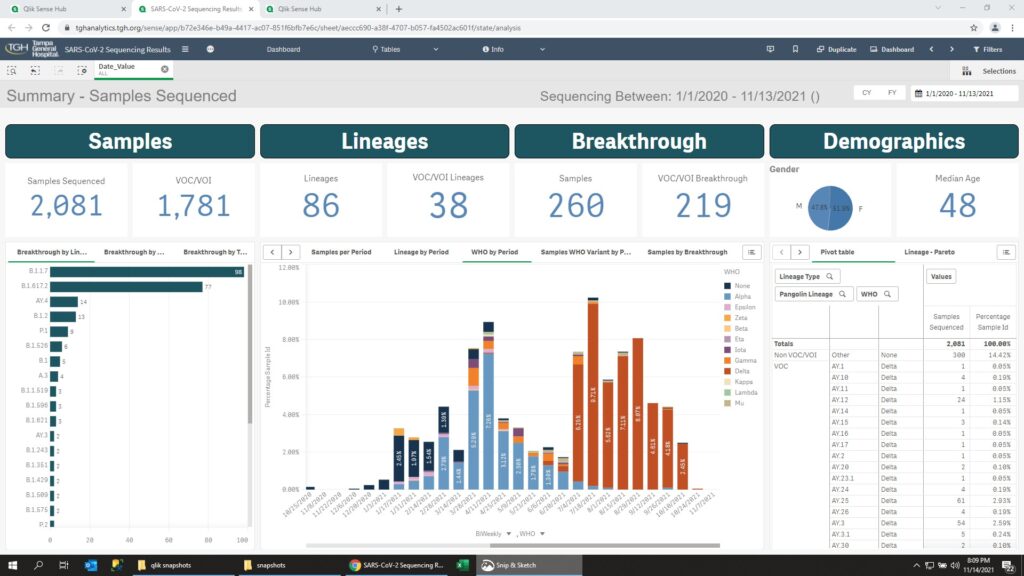
WHO designation by Period
Stacked bar, different colours represent Covid variant
WHO Variant by Period
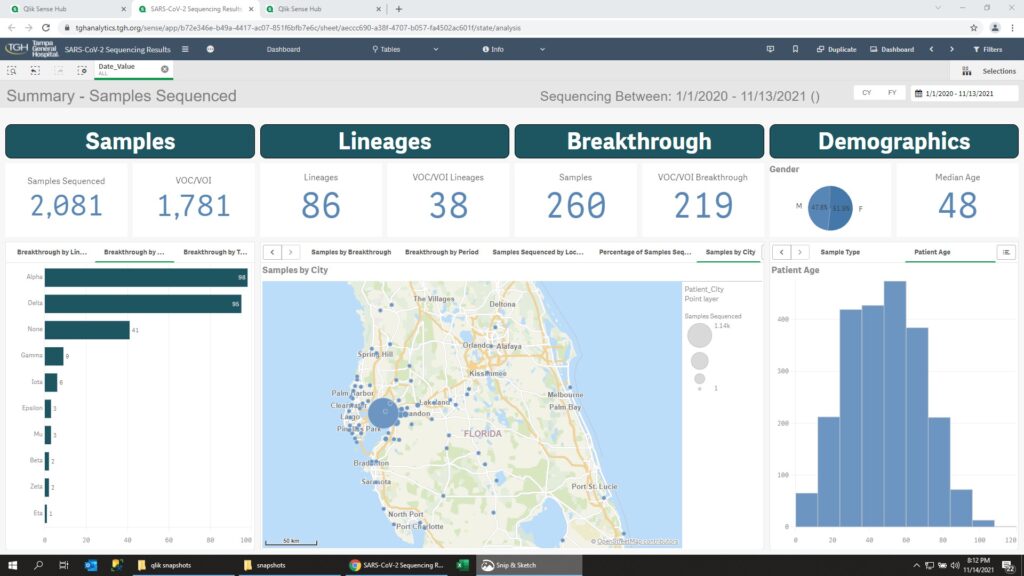
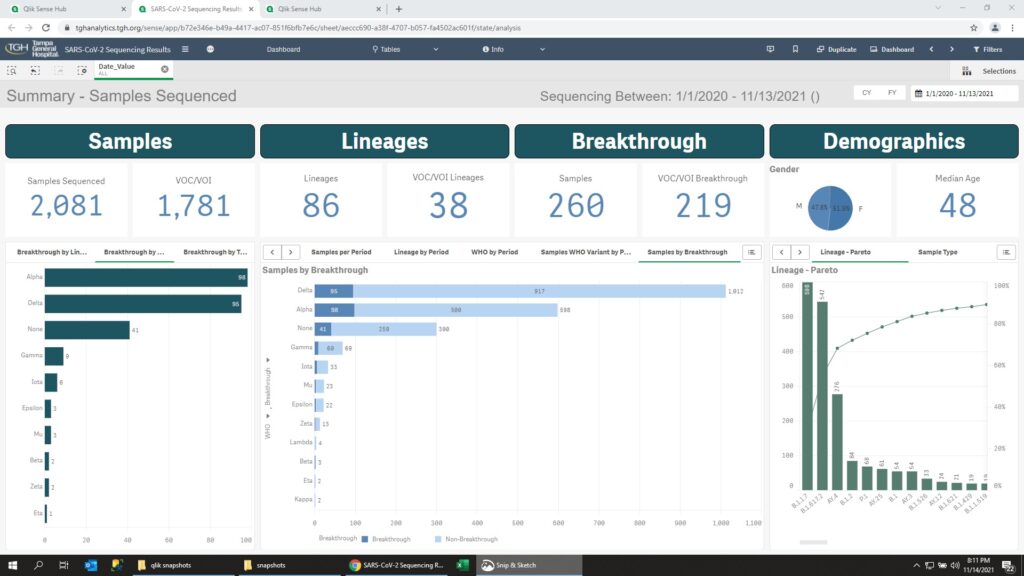
By Breakthrough
Stacked bar in the middle chart, with a Pareto chart on the right.
By Location
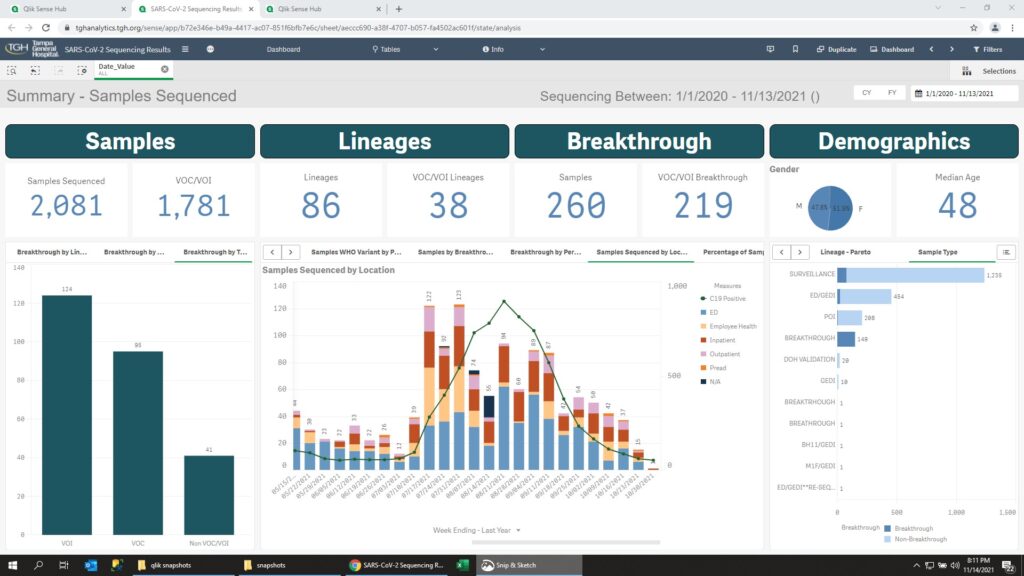
By Location
Size of the bubble indicates the number of samples
Leave a Reply