Dashboard – Service Line
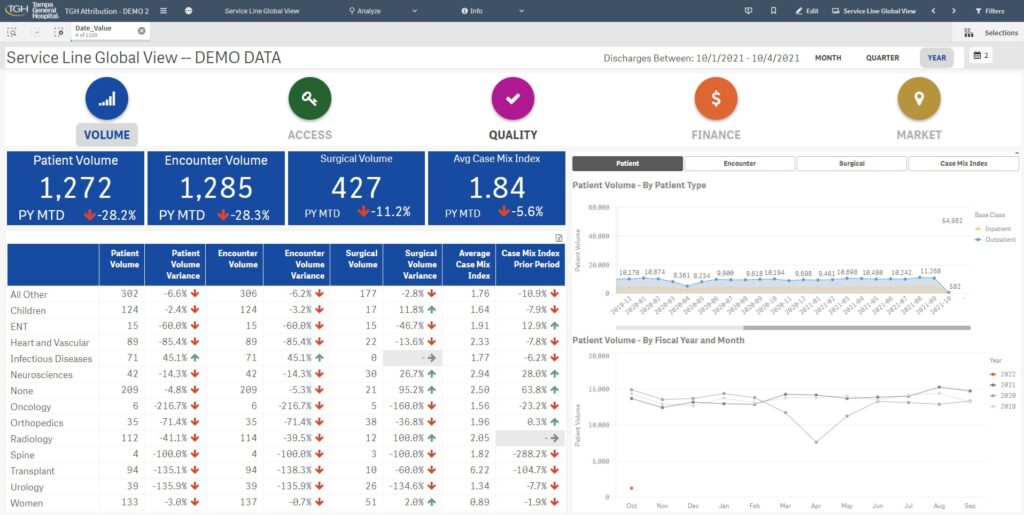
Dashboard showing summary statistics by Hospital’s different Service Lines. Showing statistics about number of patients, number of encounters, surgical volume, and case mix.
Dashboard – Service Line
Volume
Dashboard KPI’s show the volume in the current month to date, compared against the previous month to date.
The table on left summarizes by Service Line (Department)
The charts on the right show the trend for a rolling 12 months.
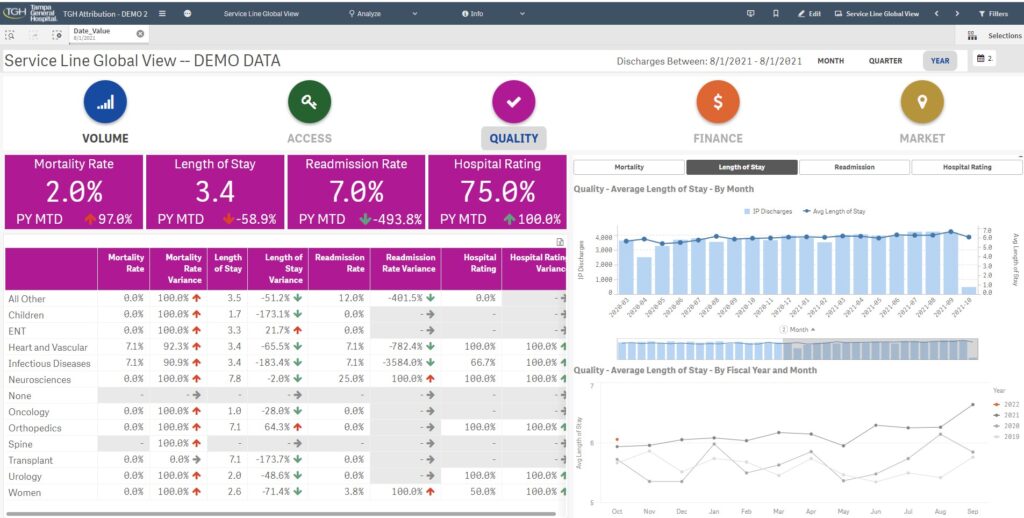
Quality
Dashboard KPI’s show the Quality metrics, in the current month to date, compared against the previous month to date.
The table on left summarizes by Service Line (Department)
The charts on the right show the trend for a rolling 12 months.
Leave a Reply