IT Service Desk Dashboard Showing performance by group, allowing to see the tables behind the charts.
Dashboard Features
Dashboard is broken up into four tabs.
- Summary
- Aging by Assignee
- Aging Ticket Details
- Summary by VP
Summary Tab
The first tab focuses on the age of the IT service tickets, with some simple aggregation of the values.
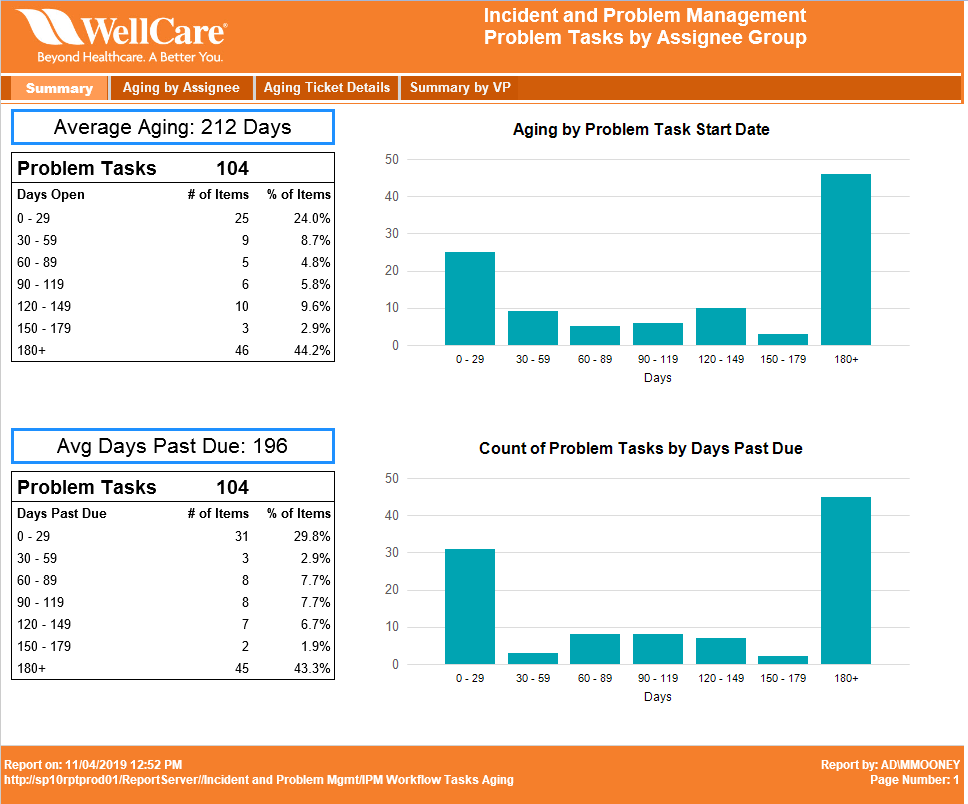
Aging by Assignee
The tab provides a pivot table grouping by assignee and count of number of tickets by number of days outstanding.

Aging Ticket Details
The tab shows the details about the tickets, and provides a link to open the ticket in the ITSM software.

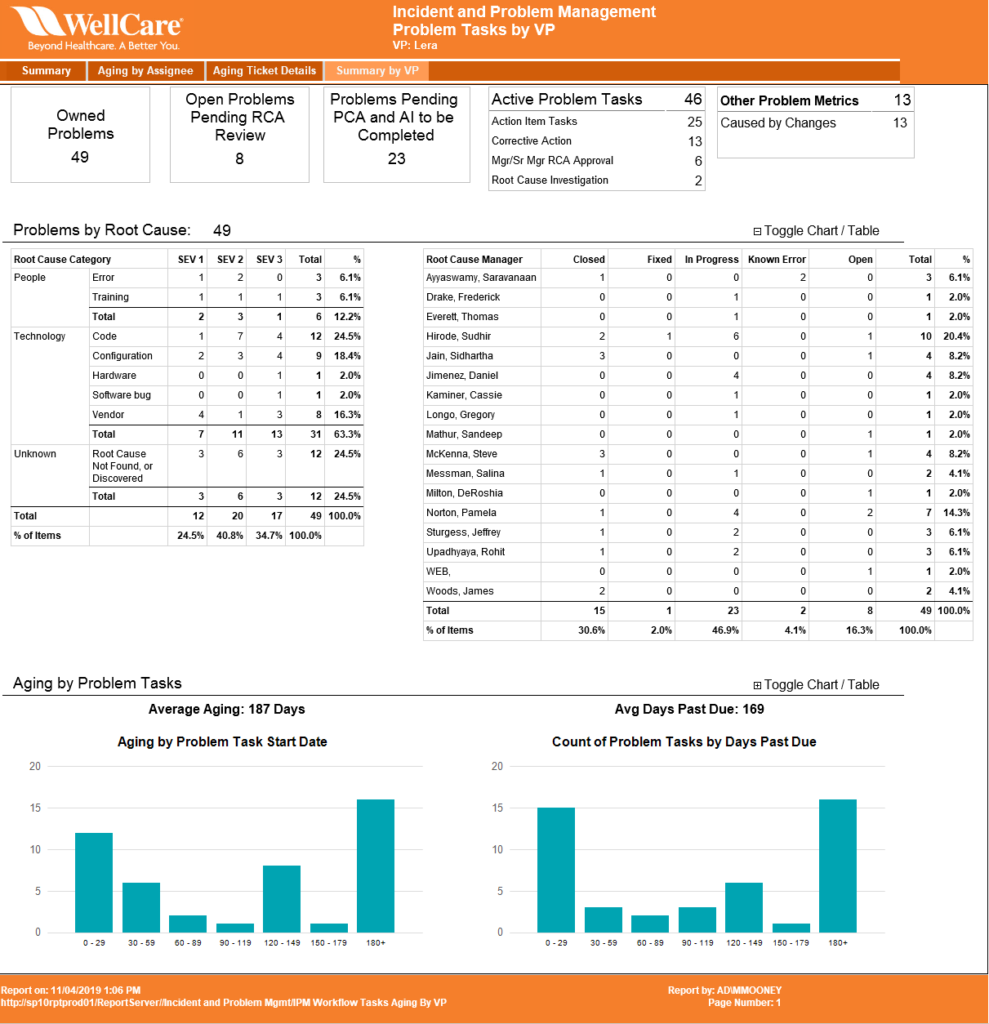
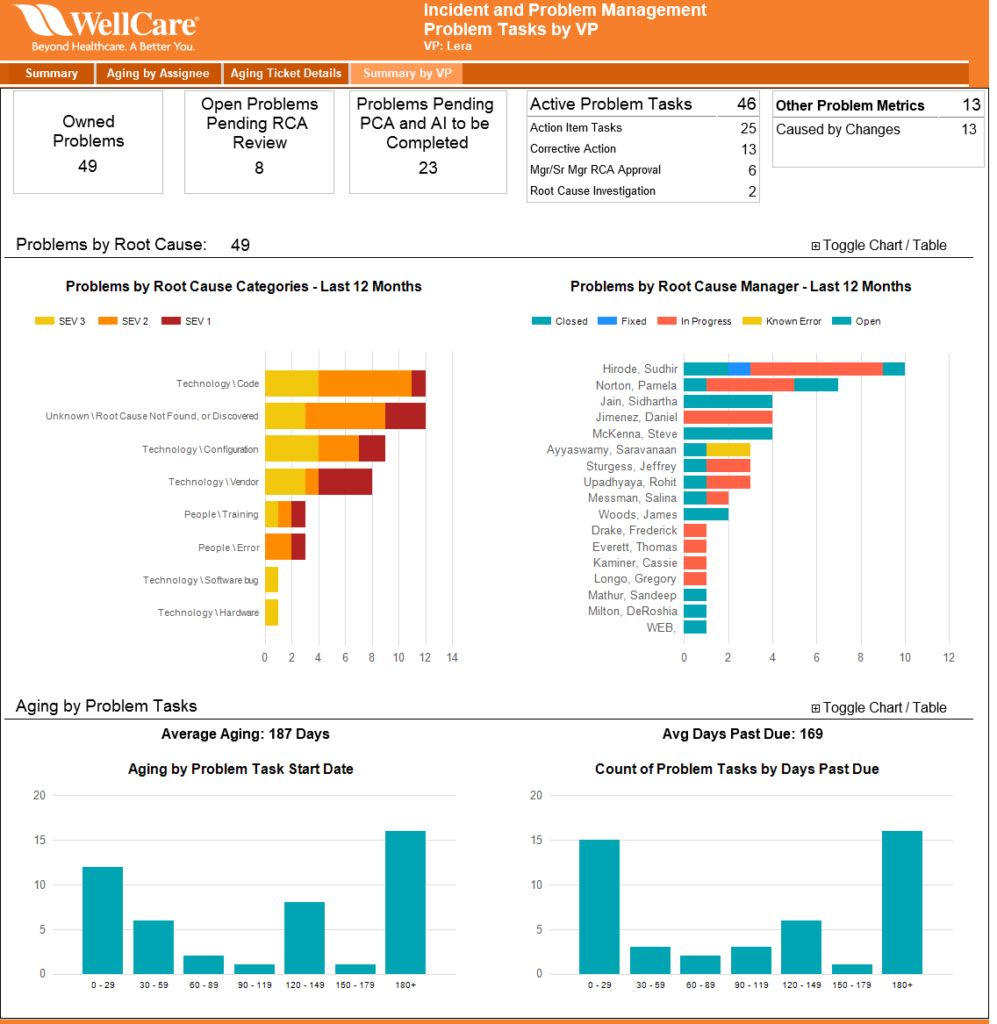
Summary by VP Tab
The dashboard allows you to filter by a VP, and show the service desk tickets assigned to the VP.
In addition the left chart shows a stacked bar chart, the number of tickets over the last 12 months, grouping the tickets by root cause and severity of the ticket, with a sev 1 ticket being the most important
The right chart shows a stacked bar chart, the number of tickets over the last 12 months, grouping by manager of the ticket and the ticket’s status.
The bottom two charts show the aging of the tickets by number of days to resolve the ticket.
Additional Feature
One of the additional features of the tab is that you can see all of the chart data in a pivot table format, by clicking the Toggle Chart / Table label.

Leave a Reply