IT Ticket Backlog for Prior 12 Months
What are you working and when will you be done?
Every VP ever.
A common question for IT service desks is how many tickets are outstanding and how many hours of work does that represent.
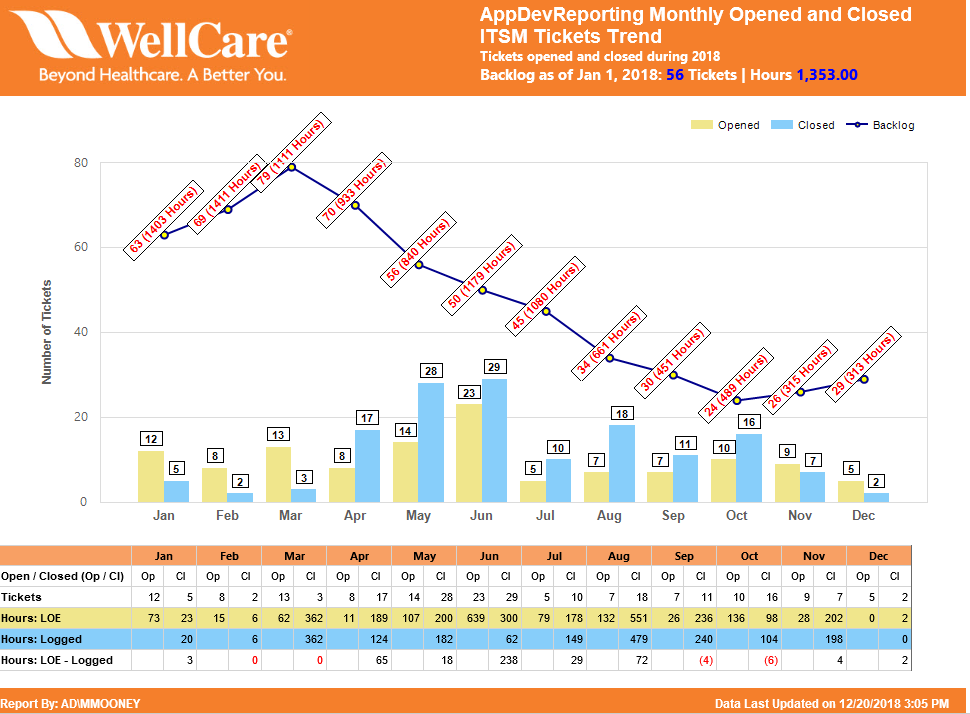
Backlog and Level of Effort (LOE) Chart
The bar chart shows number of closed (tan) and open (blue) tickets per month. The line chart is showing the backlog of tickets, and the label is showing the number and estimated number of hours (LOE) to complete the ticket.
Lastly a pivot table is placed below the chart for quick summarization and or export of the data provided.
Leave a Reply