In this step, I will look at the data to see if we can do any feature engineering. And then I will edit the data for the model, train multiple models, evaluate the best model and then test the model. Let’s get started.
Part 4 of 4
Steps for Creating the Model
Step 1 – Song Summary
Data wrangling was completed in step 3, Preparing the Data.
The overall procedure was extracting the lyrics for six artists from the website https://www.azlyrics.com including artist name, album name, year the album was released. Using the website https://www.billboard.com I extracted what was the peek rank and date of the peek rank for the song on the Billboard Hot 100 chart. The Billboard Hot 100 will be used as metric to determine the relative success of the song. While no metric can encapsulate how successful a song that all listeners would agree too, the chart is recognized by the music industry as reliable proxy.
Load Library Files
Load the necessary R library files.
|
1 2 3 4 5 6 7 |
library(tibble ,quietly = TRUE, warn.conflicts = FALSE) library(magrittr ,quietly = TRUE, warn.conflicts = FALSE) library(dplyr ,quietly = TRUE, warn.conflicts = FALSE) library(ggplot2 ,quietly = TRUE, warn.conflicts = FALSE) library(NLP ,quietly = TRUE, warn.conflicts = FALSE) #used by tm library(tm ,quietly = TRUE, warn.conflicts = FALSE) library(knitr ,quietly = TRUE, warn.conflicts = FALSE) |
Sample Record
Look at sample record in the data frame
|
1 |
df_songs_lyrics <- readr::read_tsv(file.path(paste0(getwd(), "/df_song_lyrics.txt"))) |
## Parsed with column specification:
## cols(
##   album_name = col_character(),
##   album_year = col_double(),
##   song_title = col_character(),
##   artist = col_character(),
##   peek_rank = col_double(),
##   peek_date = col_date(format = ""),
##   lyrics = col_character(),
##   album_decade = col_double(),
##   charted = col_character(),
##   NumberOne = col_logical(),
##   chart_group = col_character()
## )
|
1 2 3 4 |
# ---------------------------------------------------------------------------- # look at one of the values # ---------------------------------------------------------------------------- glimpse(df_songs_lyrics[255,]) |
Below we can see what one record from the data frame looks like.
## Observations: 1
## Variables: 11
## $ album_name   <chr> "Take Me Home"
## $ album_year   <dbl> 2012
## $ song_title   <chr> "Heart Attack"
## $ artist       <chr> "One-Direction"
## $ peek_rank    <dbl> NA
## $ peek_date    <date> NA
## $ lyrics       <chr> "\nBaby, you got me sick,\nI don't know what I did,…
## $ album_decade <dbl> 2010
## $ charted      <chr> "Not Charted"
## $ NumberOne    <lgl> FALSE
## $ chart_group  <chr> "Not Charted"
Data Dictionary
- album_name: Name of the album
- album_year: Year the album was released
- song_title: Name of the song
- artist: Artist who created the song
- peek_rank: Highest rank the song received on the Billboard Hot 100 chart
- peek_date: the date the song achieved the peek_rank
- lyrics: the song lyrics
- album_decade: decade album was released
- charted: did the album chart
- NumberOne: was it a number one song
- chart_group: was it a top ten, 11-100, or not-charted
Step 2 – Visualizations
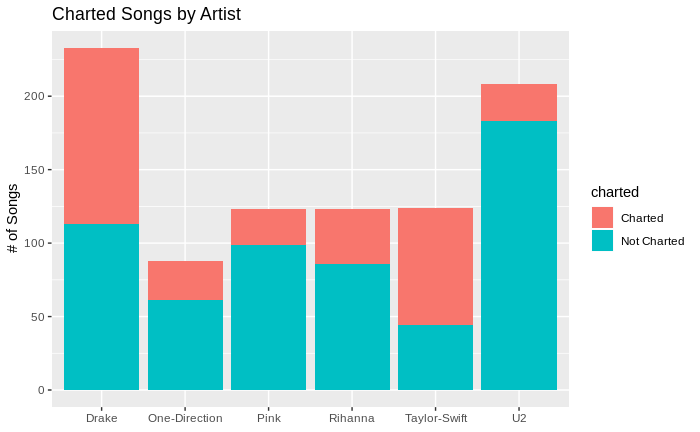
Charted Songs by Artist
In our data sample there are 899 songs, by 6 artists with 83 top 10 songs, 22 being number one songs, and 230 other songs that were in the top 100.
|
1 2 3 4 5 6 7 8 9 10 11 12 |
library(ggplot2 ,quietly = TRUE, warn.conflicts = FALSE) df_songs_lyrics %>% group_by(artist, charted) %>% summarise(number_of_songs = n()) %>% ggplot() + geom_bar(aes(x=artist ,y=number_of_songs ,fill = charted) ,stat = "identity") + labs(x=NULL, y="# of Songs")+ ggtitle("Charted Songs by Artist") |
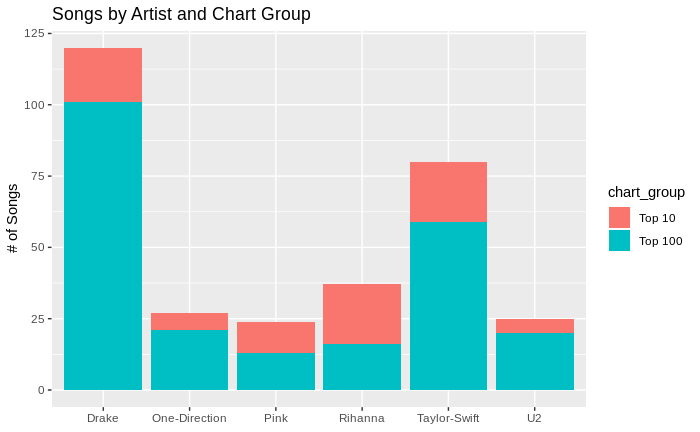
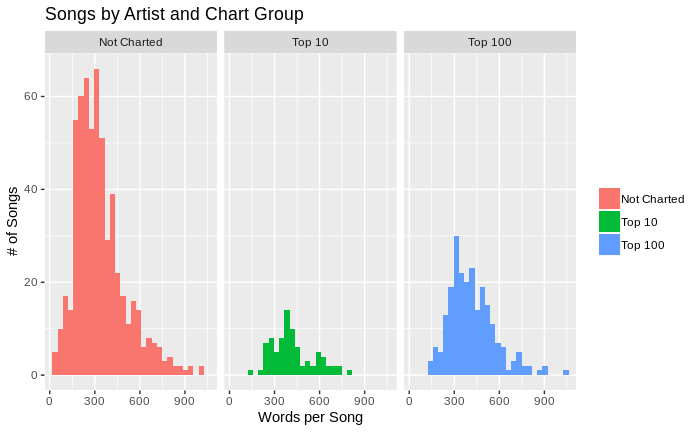
Songs by Artist and Chart Group
|
1 2 3 4 5 6 7 8 9 10 11 |
df_songs_lyrics %>% group_by(artist, chart_group) %>% filter(peek_rank > 0) %>% summarise(number_of_songs = n()) %>% ggplot() + geom_bar(aes(x=artist ,y=number_of_songs ,fill = chart_group) ,stat = "identity") + labs(x=NULL, y="# of Songs") + ggtitle("Songs by Artist and Chart Group") |
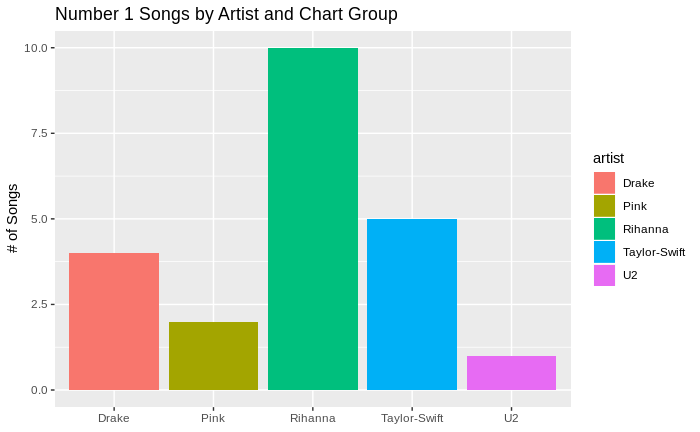
Number 1 Songs by Artist
|
1 2 3 4 5 6 7 8 9 10 11 |
df_songs_lyrics %>% group_by(artist) %>% filter(peek_rank == 1) %>% summarise(number_of_songs = n()) %>% ggplot() + geom_bar(aes(x=artist ,y=number_of_songs ,fill = artist) ,stat = "identity") + labs(x=NULL, y="# of Songs") + ggtitle("Number 1 Songs by Artist and Chart Group") |
Lyric Details
Step 3 – Prepare the lyrics for analysis
In preparing the lyrics for analysis need to do the following.
- Remove any unique words, words in the source document that weren’t meant to be part of the lyrics
- Ensure everything is in lower case
- Remove any numbers or punctuation that was in the lyrics. The main reason is to remove apostrophes from contraction words, however it will also remove any commas or periods from the text.
- Remove stop words from the lyrics
- Strip any white space around the words.
- Lastly remove any word that isn’t at least three characters in length.
Stop words are common words that we will remove before the text analysis. There is no common universal list of stop words, and it is subjective as to which stop words to remain and remove. In addition to the list of stop words listed in the snowball R package I have included some other words I wanted to remove because I don’t think they add value to the analysis.
|
1 2 3 4 5 6 7 8 9 10 11 12 13 14 15 16 17 18 19 20 21 22 23 24 25 26 27 28 29 30 |
remove_words <- c("chorus", "repeat" ,"hey" ,"uh" ,"whoa" ) scrubLyrics <- function(text_lyric){ # convert to lower case, remove numbers, punctuation, stopwords, whitespace text_lyric <- text_lyric %>% tolower() %>% removeNumbers() %>% removePunctuation() %>% removeWords(stopwords("en")) %>% stripWhitespace() return(text_lyric) } # copy into new dataframe df_scrubbedLyrics <- df_songs_lyrics # scrub the lyrics df_scrubbedLyrics$lyrics <- lapply(df_scrubbedLyrics$lyrics, scrubLyrics) # tokenize the lyrics # expand the data frame so one word per row # remove df_scrubbedLyrics <- df_scrubbedLyrics %>% tidytext::unnest_tokens(t_words , lyrics) %>% filter(!t_words %in% remove_words) %>% filter(nchar(t_words) >=3 ) |
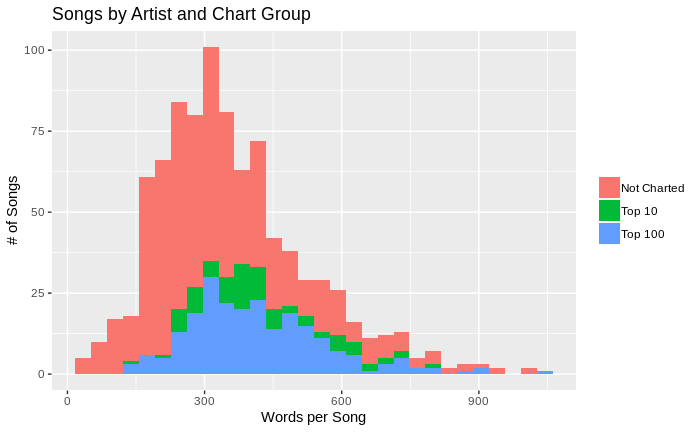
Word Frequency
One of the features of songs we want to explore is, does the number of words in a song impact it’s performance? I will look at the total number of words in the songs to help determine.
|
1 2 3 4 5 6 7 8 9 10 11 12 13 |
df_all_words <- df_songs_lyrics %>% unnest_tokens(t_words , lyrics) %>% group_by(artist, song_title, chart_group) %>% summarise(word_count = n()) %>% arrange(desc(word_count)) df_all_words %>% ggplot() + geom_histogram( aes(x=word_count, fill=chart_group)) + labs(x="Words per Song", y="# of Songs") + ggtitle("Songs by Artist and Chart Group") + theme(legend.title = element_blank()) |
Compare the chart groups side by side
|
1 2 3 4 5 6 7 |
df_all_words %>% ggplot() + geom_histogram( aes(x=word_count, fill=chart_group)) + facet_wrap(~chart_group, ncol = 3) + labs(x="Words per Song", y="# of Songs") + ggtitle("Songs by Artist and Chart Group") + theme(legend.title = element_blank()) |
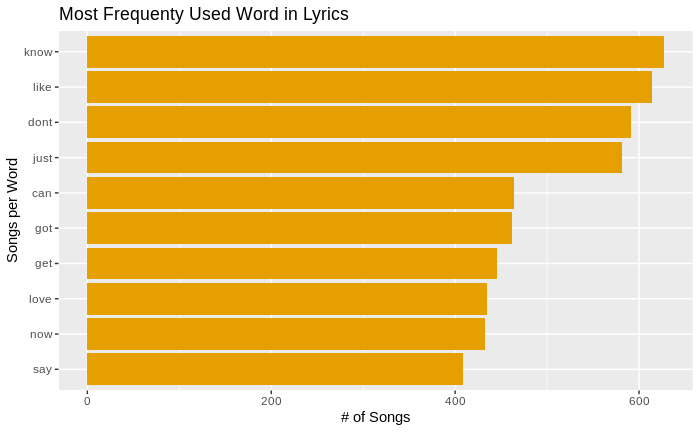
Most Common Words Used in Lyrics
|
1 2 3 4 5 6 7 8 9 10 11 |
df_scrubbedLyrics %>% distinct() %>% count(t_words, sort = TRUE) %>% top_n(10) %>% ungroup() %>% mutate(t_words = reorder(t_words, n)) %>% ggplot() + geom_col(aes(t_words, n), fill = "#E69F00") + coord_flip() + labs(x="Songs per Word", y="# of Songs") + ggtitle("Most Frequenty Used Word in Lyrics") |
|
1 2 3 4 5 6 7 8 9 10 11 12 13 14 15 16 17 18 19 |
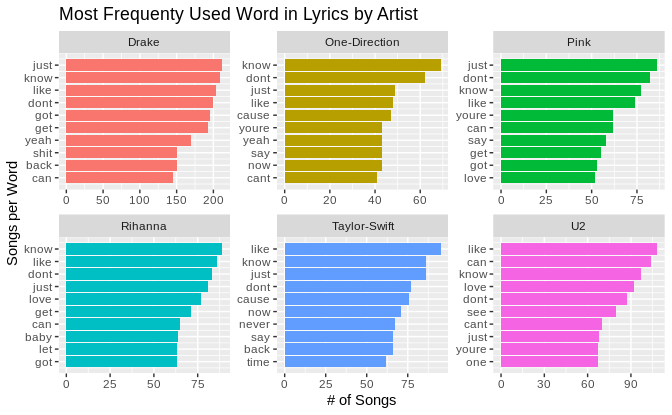
words_by_artist <- df_scrubbedLyrics %>% distinct() %>% group_by(artist) %>% count(t_words, artist, sort = TRUE) %>% slice(seq_len(10)) %>% ungroup() %>% arrange(artist , n) %>% mutate(display_row = row_number()) words_by_artist %>% ggplot() + geom_col(aes(display_row, n, fill=artist) ,show.legend = FALSE) + coord_flip() + facet_wrap(~artist, scales = "free") + scale_x_continuous(labels = words_by_artist$t_words ,breaks = words_by_artist$display_row) + labs(x="Songs per Word", y="# of Songs") + ggtitle("Most Frequenty Used Word in Lyrics by Artist") |
|
1 2 3 4 5 6 7 8 9 10 11 12 13 14 15 16 17 18 19 |
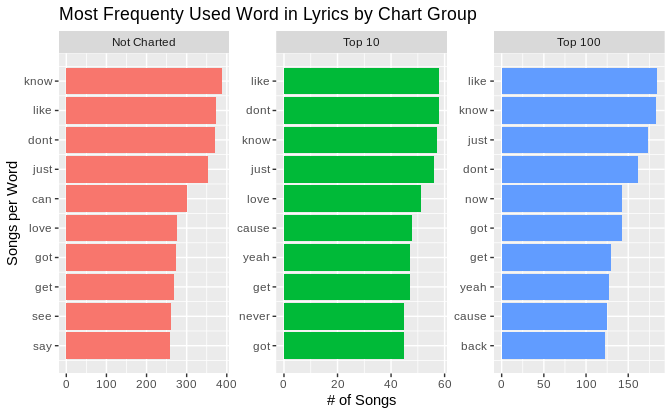
words_by_chart_group <- df_scrubbedLyrics %>% distinct() %>% group_by(chart_group) %>% count(t_words, chart_group, sort = TRUE) %>% slice(seq_len(10)) %>% ungroup() %>% arrange(chart_group , n) %>% mutate(display_row = row_number()) words_by_chart_group %>% ggplot() + geom_col(aes(display_row, n, fill=chart_group) ,show.legend = FALSE) + coord_flip() + facet_wrap(~chart_group, scales = "free") + scale_x_continuous(labels = words_by_chart_group$t_words ,breaks = words_by_chart_group$display_row) + labs(x="Songs per Word", y="# of Songs") + ggtitle("Most Frequenty Used Word in Lyrics by Chart Group") |
Prediction
Step 4 Model Building
Take a quick look at the summarized view of the artists, number of songs and how many top 10 and top 100 songs the artist had
|
1 2 3 4 |
library(tibble ,quietly = TRUE, warn.conflicts = FALSE) library(magrittr ,quietly = TRUE, warn.conflicts = FALSE) library(dplyr ,quietly = TRUE, warn.conflicts = FALSE) library(ggplot2 ,quietly = TRUE, warn.conflicts = FALSE) |
|
1 2 3 4 5 6 |
df_songs_lyrics %>% group_by(artist ,chart_group) %>% summarise(SongCount = n()) %>% reshape2::dcast(artist ~ chart_group, value.var = "SongCount") %>% `colnames<-` (c("artist","Not.Charted","Top.10","Top.100")) %>% mutate(Total = Top.10 + Top.100 + Not.Charted) |
##          artist Not.Charted Top.10 Top.100 Total
## 1         Drake         113     19     101   233
## 2 One-Direction          61      6      21    88
## 3          Pink          99     11      13   123
## 4       Rihanna          86     21      16   123
## 5  Taylor-Swift          44     21      59   124
## 6            U2         183      5      20   208
Now look at wow many unique words are in each chart group. The word needs to be used in at least three songs.
|
1 2 3 4 5 6 7 8 9 10 11 12 13 |
select_n_words <- 5000 df_top_words_per_group <- df_scrubbedLyrics %>% group_by(chart_group) %>% mutate(group_word_count = n()) %>% group_by(chart_group, t_words) %>% mutate(word_count = n() ,word_percent = word_count / group_word_count) %>% select(t_words, chart_group, group_word_count, word_count, word_percent) %>% distinct() %>% filter(word_count >= 3) %>% arrange(desc(word_percent)) %>% top_n(select_n_words) |
Selecting by word_percent
I am going to removed words that are in more than one group.
|
1 2 3 4 5 6 7 8 9 10 11 12 |
# remove words that are in more than one group df_top_words <- df_top_words_per_group %>% ungroup() %>% group_by(t_words) %>% mutate(multi_group = n()) %>% filter(multi_group < 2) %>% select(chart_group, common_word = t_words) # create lists of unique words by chart_group words_not_charted <- lapply(df_top_words[df_top_words$chart_group == "Not Charted",], as.character) words_top_100 <- lapply(df_top_words[df_top_words$chart_group == "Top 100",], as.character) words_top_10 <- lapply(df_top_words[df_top_words$chart_group == "Top 10",], as.character) |
Breaking the data frame into testing and training group.
|
1 2 3 4 5 6 7 8 9 10 11 12 13 14 15 16 17 18 19 20 21 |
# 50, 10, 20 library(purrr) library(tidyr) set.seed(8020) test_lyric <- df_songs_lyrics %>% mutate(uid = seq(1,length(df_songs_lyrics$album_name))) %>% group_by(chart_group) %>% nest() %>% ungroup() %>% mutate(n = c(50,20,10)) %>% mutate(samp = map2(data, n, sample_n)) %>% select(-data) %>% unnest(samp) train_lyric <- df_songs_lyrics %>% mutate(uid = seq(1,length(df_songs_lyrics$album_name))) train_lyric <- anti_join(train_lyric, test_lyric, by='uid') |
Use the custom function created earlier to convert all the text to lower case, remove any numbers, remove any punctuation, remove any stop words, and remove any extra white space in the text.
Added the function lyric_features to add the additional columns for feature engineering.
And lastly created the training and test data frames.
|
1 2 3 4 5 6 7 8 9 10 11 12 13 14 15 16 17 18 19 20 21 22 23 24 25 26 27 28 29 30 31 32 33 34 35 36 37 38 39 40 41 42 43 44 45 46 47 48 49 50 51 52 53 54 55 56 57 58 59 60 61 62 63 64 65 66 67 |
# put to lower case, remove punctuation, and stop words train_lyric$lyrics <- lapply(train_lyric$lyrics, scrubLyrics) test_lyric$lyrics <- lapply(test_lyric$lyrics, scrubLyrics) # build into tidy versions of the dataframes # put into long data set train_lyric_scrubbed <- train_lyric %>% select(-uid) %>% tidytext::unnest_tokens(t_words , lyrics) test_lyric_scrubbed <- test_lyric %>% select(-n,-uid) %>% tidytext::unnest_tokens(t_words , lyrics) lyric_features <- function(lyric){ lf <- lyric %>% group_by(song_title) %>% mutate(word_frequency = n() , lexical_diversity = n_distinct(t_words) , lexical_density = lexical_diversity / word_frequency , reptition = word_frequency / lexical_diversity , song_avg_word_length = mean(nchar(t_words)) , song_title_words = lengths(gregexpr("[A-z]\\W+",song_title)) +1L , song_title_length = nchar(song_title) , large_word_count = sum(ifelse((nchar(t_words)>7),1,0)) , small_word_count = sum(ifelse((nchar(t_words)<3),1,0)) , top_10_word_count = sum(ifelse(t_words %in% words_top_10$common_word,15,0)) , top_100_word_count = sum(ifelse(t_words %in% words_top_100$common_word,5,0)) , uncharted_word_count = sum(ifelse(t_words %in% words_not_charted$common_word,5,0)) ) %>% select(-t_words) %>% select(album_name #1. chr , song_title #2. chr , artist #3. chr , peek_date #4. date , charted #5. chr , NumberOne #6. bool , peek_rank #7. num , album_year #8. num , album_decade #9. num , word_frequency #10. num , lexical_diversity #11. num , lexical_density #12. num , reptition #13. num , song_avg_word_length #14. num , song_title_words #15. num , song_title_length #16. num , large_word_count #17. num , small_word_count #18. num , top_10_word_count #19. num , top_100_word_count #20. num , uncharted_word_count #21. num , chart_group #22. factor 3 levels ) %>% distinct() %>% ungroup() lf$chart_group <- as.factor(lf$chart_group) return(lf) } train_data_fe <- lyric_features(train_lyric_scrubbed) test_data_fe <- lyric_features(test_lyric_scrubbed) |
Building the Model
Normalize the datasets
Need to normalize the datasets for each of the models, using a range of 0 to 1.
|
1 2 3 4 5 6 7 8 9 10 11 12 13 14 15 |
col_nm <-c("word_frequency","lexical_diversity","reptition" ,"song_avg_word_length","song_title_words","song_title_length" ,"large_word_count","small_word_count","top_10_word_count" ,"top_100_word_count","uncharted_word_count" ) train_data_nm <- normalizeFeatures(train_data_fe ,method = "standardize" ,cols=col_nm ,range=c(0,1) ,on.constant = "quiet") test_data_nm <- normalizeFeatures(test_data_fe ,method = "standardize" ,cols=col_nm ,range=c(0,1) ,on.constant = "quiet") |
Create the Classifiers
Using a variety of models, including Naive Bayes, LDA, KSVM, KNN, RPart, Random Forest, XGBoost, and NNET.
|
1 2 3 4 5 6 7 8 9 10 11 12 13 |
# will use a variety of models to see if any of the models # preform better with lyrics models = list( makeLearner("classif.naiveBayes", id = "Naive Bayes") , makeLearner("classif.lda", id = "LDA") , makeLearner("classif.ksvm", id = "SVM") , makeLearner("classif.knn", id = "KNN") , makeLearner("classif.rpart", id = "RPART", predict.type = "prob") , makeLearner("classif.randomForest", id = "Random Forest", predict.type = "prob") , makeLearner("classif.xgboost", id = "XG Boost", predict.type = "prob") , makeLearner("classif.nnet", id = "Neural Net", predict.type = "prob") ) |
|
1 2 3 4 5 6 7 8 9 10 11 12 13 14 15 16 17 18 19 20 21 |
# use cross fold validation cfold <- makeResampleDesc("CV" ,iters = 10, stratify = TRUE) # make classifiers exclude_cols = c(1:7) train_clf <- makeClassifTask(id="Lyrics" , data = train_data_nm[-exclude_cols] , target = "chart_group" ) test_clf <- makeClassifTask(id="Lyrics" , data = test_data_nm[-exclude_cols] , target = "chart_group" ) lyric_train_benchmark <- benchmark(models ,tasks = train_clf ,resamplings = cfold ,measures = list(acc, timetrain) ,show.info = FALSE ) |
## # weights:  57
## initial  value 1047.511809
## final  value 621.130815
## converged
## # weights:  57
## initial  value 704.646831
## final  value 618.710946
## converged
## # weights:  57
## initial  value 774.548012
## final  value 621.555100
## converged
## # weights:  57
## initial  value 1126.475235
## final  value 621.130815
## converged
## # weights:  57
## initial  value 759.930246
## final  value 618.710946
## converged
## # weights:  57
## initial  value 875.447375
## final  value 621.555100
## converged
## # weights:  57
## initial  value 1810.948881
## final  value 621.130815
## converged
## # weights:  57
## initial  value 768.154519
## final  value 621.555100
## converged
## # weights:  57
## initial  value 695.485397
## final  value 619.133874
## converged
## # weights:  57
## initial  value 626.916621
## final  value 621.130815
## converged
Run the benchmark for each of the models and find out which model preforms best.
|
1 2 |
# Run the benchmark lyric_train_benchmark |
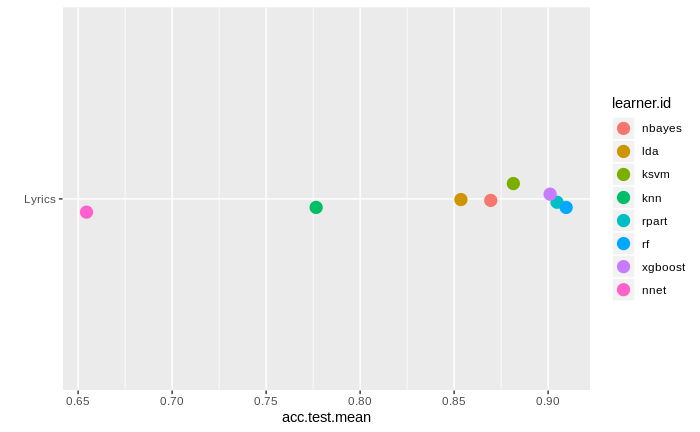
It looks like that Random Forest has the best results. Ok. It will be what I will use in the testing set.
##   task.id    learner.id acc.test.mean timetrain.test.mean
## 1  Lyrics   Naive Bayes     0.8706484              0.0039
## 2  Lyrics           LDA     0.8560566              0.0119
## 3  Lyrics           SVM     0.8756448              0.0771
## 4  Lyrics           KNN     0.7680821              0.0001
## 5  Lyrics         RPART     0.9011682              0.0056
## 6  Lyrics Random Forest     0.9109544              0.3485
## 7  Lyrics      XG Boost     0.8999476              0.0038
## 8  Lyrics    Neural Net     0.6544656              0.0055
Plot Training Results
Here we can see a nice plot of how the different models performed. The only models that did terrible were KNN, and NNET. The rest of the models were above 0.85.
|
1 |
plotBMRSummary(lyric_train_benchmark) |
Confusion Matrix
Now looking at confusion matrix for our Random Forest Model. The matrix shows us the correctly identified and incorrectly identified items.
|
1 2 |
predictions_train <- getBMRPredictions(lyric_train_benchmark) calculateConfusionMatrix(predictions_train$Lyrics$`Random Forest`)$result |
##              predicted
## true          Not Charted Top 10 Top 100 -err.-
##   Not Charted         524      0      12     12
##   Top 10               21     50       2     23
##   Top 100              37      1     172     38
##   -err.-               58      1      14     73
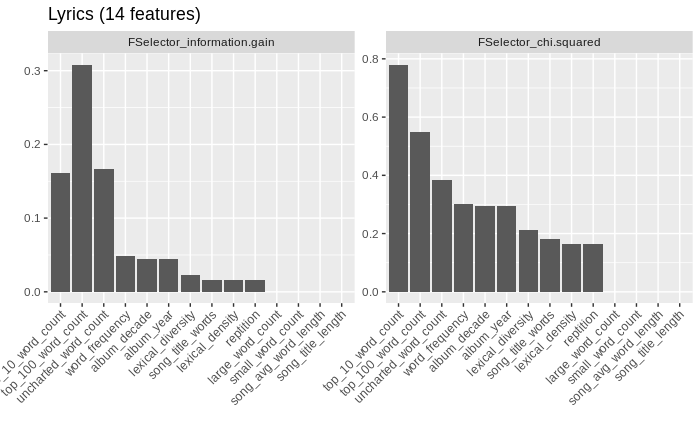
Feature Importance
Now to see what features contribute to the aiding in the prediction of the model. Top 10 word count and top 100 word count are the most significant. And as one would imagine the length of the song title has almost no significance.
|
1 2 3 4 5 |
# feature importance feature_importance <- generateFilterValuesData(task = train_clf ,method = c("FSelector_information.gain", "FSelector_chi.squared") ) plotFilterValues(feature_importance,n.show = 20) |
Testing the Model
Our final step is to test the model. Our accuracy is 0.925. The model’s performance is quite acceptable.
|
1 2 3 |
rf_model <- train("classif.randomForest",train_clf) result_rf <- predict(rf_model, test_clf) performance(result_rf, measures = acc) |
##   acc
## 0.925
|
1 |
calculateConfusionMatrix(pred = result_rf) |
##              predicted
## true          Not Charted Top 10 Top 100 -err.-
##   Not Charted          50      0       0      0
##   Top 10                4      6       0      4
##   Top 100               2      0      18      2
##   -err.-                6      0       0      6
Enhancing the Model
Naturally I am only looking at small subset of all artists. The way to increase the accuracy of the model would be to increase the number of artists, and bring in their lyrics.
Leave a Reply