Spark – Streaming Data, Capturing and Querying
Today we will look at how to capture streaming data and perform some simple queries as the data is streamed. We will use the regular expressions library and the PySpak library. The streaming data comes from a weather station that transmits different weather at different intervals. We will need to find the correct data out of the stream and output the results.
Let’s get started.
Environment Initialization
The streaming data comes from a weather station located in Southern California, USA. The University of San Diego has a web portal to be able to read the data as it is passed from the weather stations to their computer center. We will connect to the web portal and read the raw values as they are repeated.
Some measurements are transmitted more frequently than others. Wind speed and wind direction are transmitted more often, while temperature and rain are transmitted at longer intervals.
Example Weather Data
|
1 2 3 4 5 6 7 8 |
# Example weather station data # # 1419408015 0R1,Dn=059D,Dm=066D,Dx=080D,Sn=8.5M,Sm=9.5M,Sx=10.3M # 1419408016 0R1,Dn=059D,Dm=065D,Dx=078D,Sn=8.5M,Sm=9.5M,Sx=10.3M # 1419408016 0R2,Ta=13.9C,Ua=28.5P,Pa=889.9H # 1419408017 0R1,Dn=059D,Dm=064D,Dx=075D,Sn=8.7M,Sm=9.6M,Sx=10.3M # 1419408018 0R1,Dn=059D,Dm=064D,Dx=075D,Sn=8.9M,Sm=9.6M,Sx=10.3M # 1419408019 0R1,Dn=059D,Dm=065D,Dx=075D,Sn=8.8M,Sm=9.5M,Sx=10.3M |
Description of some of the codes used in the weather data.
|
1 2 3 4 5 6 7 8 9 10 11 12 13 14 15 16 17 18 19 20 21 22 23 24 |
# Key for measurements: # # Sn Wind speed minimum m/s, km/h, mph, knots #,M, K, S, N # Sm Wind speed average m/s, km/h, mph, knots #,M, K, S, N # Sx Wind speed maximum m/s, km/h, mph, knots #,M, K, S, N # Dn Wind direction minimum deg #, D # Dm Wind direction average deg #, D # Dx Wind direction maximum deg #, D # Pa Air pressure hPa, Pa, bar, mmHg, inHg #, H, P, B, M, I # Ta Air temperature °C, °F #, C, F # Tp Internal temperature °C, °F #, C, F # Ua Relative humidity %RH #, P # Rc Rain accumulation mm, in #, M, I # Rd Rain duration s #, S # Ri Rain intensity mm/h, in/h #, M, I # Rp Rain peak intensity mm/h, in/h #, M, I # Hc Hail accumulation hits/cm2, hits/in2, hits #, M, I, H # Hd Hail duration s #, S # Hi Hail intensity hits/cm2h, hits/in2h, hits/ h #, M, I, H # Hp Hail peak intensity hits/cm2h, hits/in2h, hits/ h #, M, I, H # Th Heating temperature °C, °F #, C, F # Vh Heating voltage V #, N, V, W, F2 # Vs Supply voltage V V # Vr 3.5 V ref. voltage V V |
Today we will be looking at the Wind Direction average weather data as it is streamed from the weather station.
Parse the Weather Data
We will use a regular expression to extract the wind direction weather data from the other transmitted data.
|
1 2 3 4 5 6 7 8 9 10 11 |
# Parse a line of weather station data, returning the average wind direction measurement # import the regular expressions library import re # Function for parsing each line of weather data def parse(line): match = re.search("Dm=(\d+)", line) if match: val = match.group(1) return [int(val)] return [] |
As the weather data is read in, we will search for lines that Dm= and extract the direction of the wind. The integer value refers to the compass direction for the wind direction. For example 0 would be North, 90 for East, etc.
Next we will use the streaming object from the PySpark library to connect to the web portal and get the weather data.
|
1 2 3 4 5 |
from pyspark.streaming import StreamingContext ssc = StreamingContext(sc, 1) # connect to the web portal at port 12020 lines = ssc.socketTextStream("redacted.redacted.ucsd.edu" ,12020) |
Note: I removed the real web address because I don’t have permission to grant to other people access to the weather data.
As each line of weather data is received it will be stored in the variable lines.
|
1 2 3 4 5 6 7 8 9 10 |
vals = lines.flatMap(parse) window = vals.window(10 ,5) # custom function to get summary statistics, max and min def stats(rdd): print(rdd.collect()) if rdd.count()>0: print("max = {}, min={}".format(rdd.max(), rdd.min())) window.foreachRDD(lambda rdd: stats(rdd)) |
We defined a custom function to read through the lines of data and print out the max and min values for the specified window of data.
Next we will open the connection to the streaming data and view the results.
|
1 |
ssc.start() |
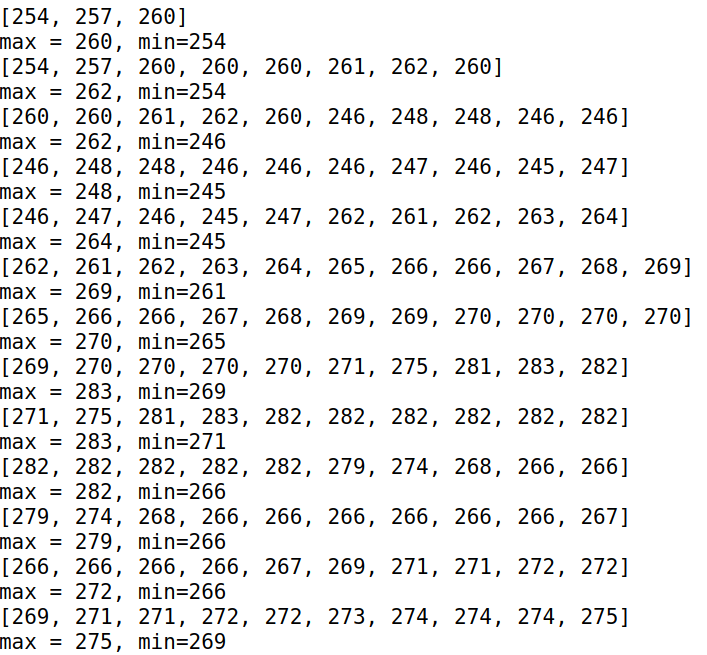
As the streaming data comes in we can see how the function is looking at the last 10 values and determining the max and min value.
And lastly we need to make sure we close our streaming connection.
|
1 |
ssc.stop() |
In this post we created custom functions to query streaming data, made a connection to streaming data source, and had the real time results show us the current max and min values for the specified window.
I hope you found the above informative, let me know if you have any questions in the comments below.
— michael.data@eipsoftware.com
Leave a Reply