IT Service Desk Dashboard Showing performance by group, allowing to see the tables behind the charts.
IT Service Desk Dashboard Showing performance by group, allowing to see the tables behind the charts.
What are you working and when will you be done?
Every VP ever.
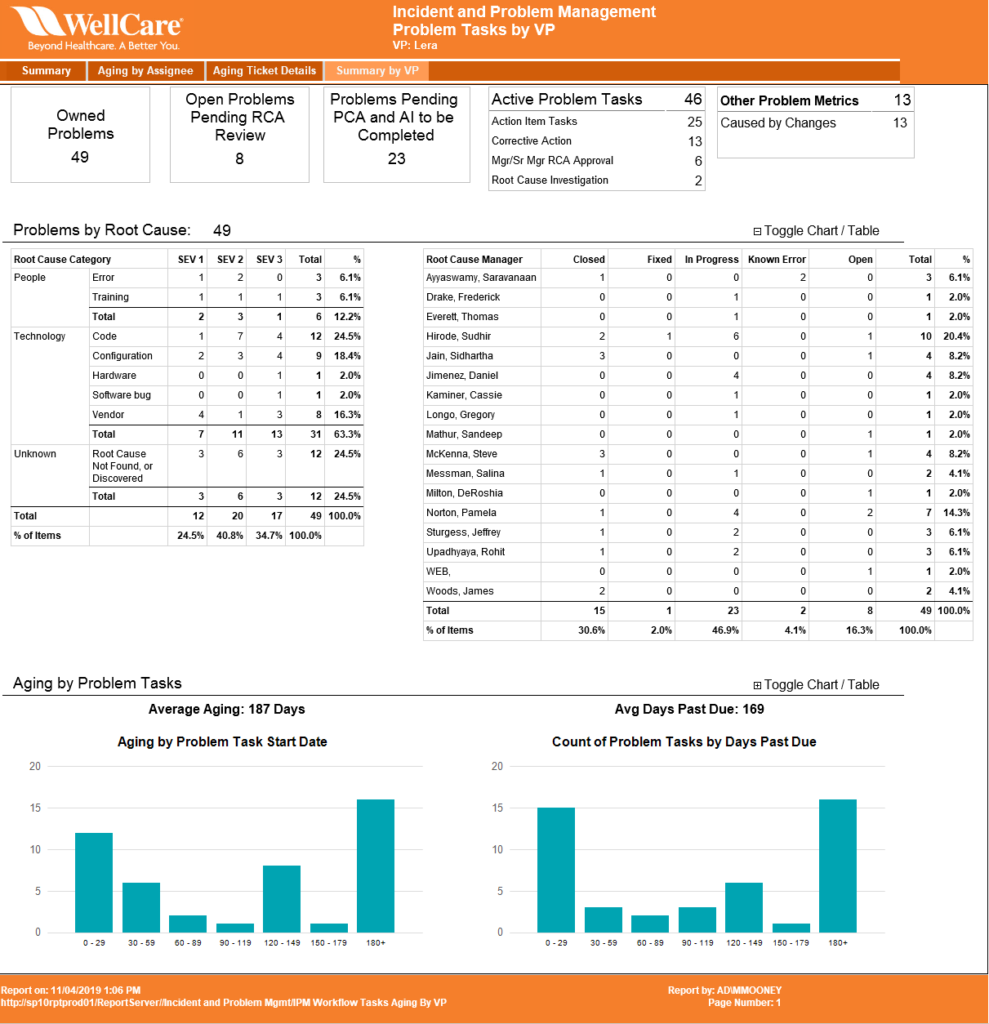
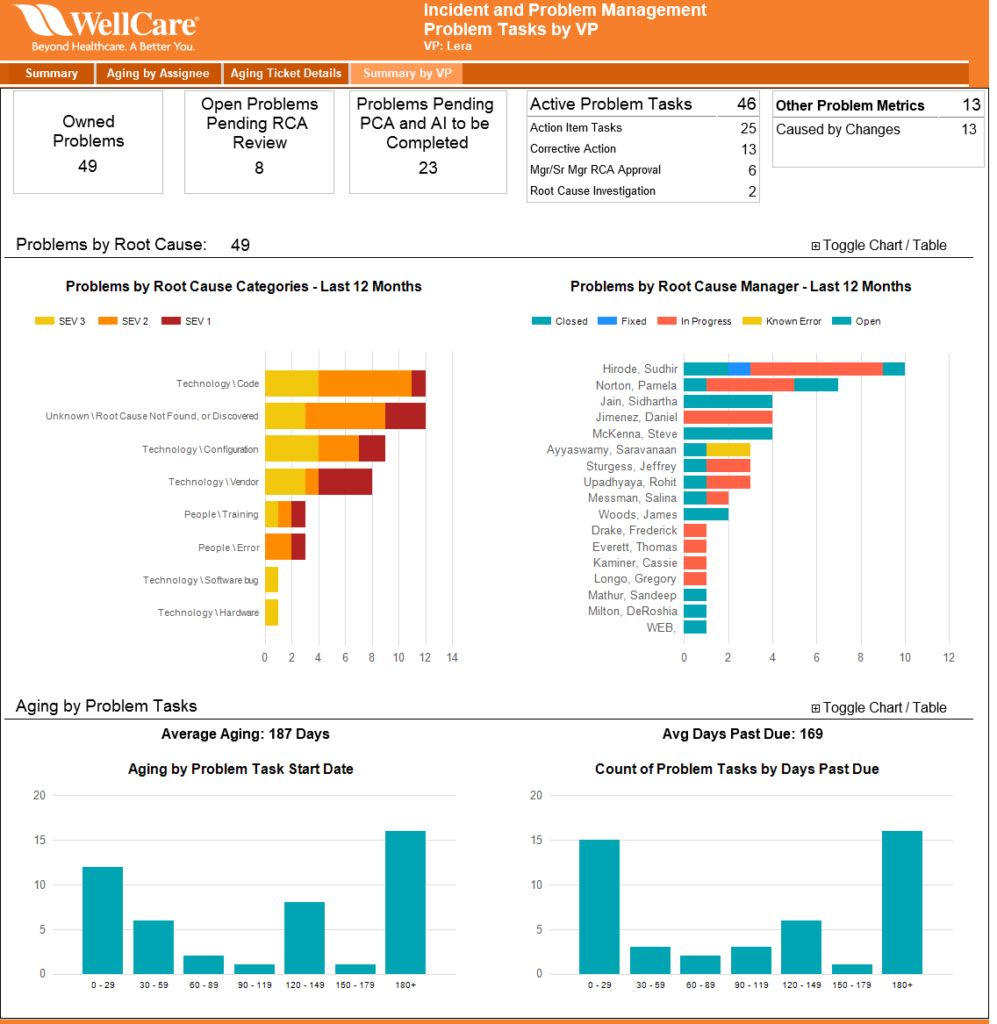
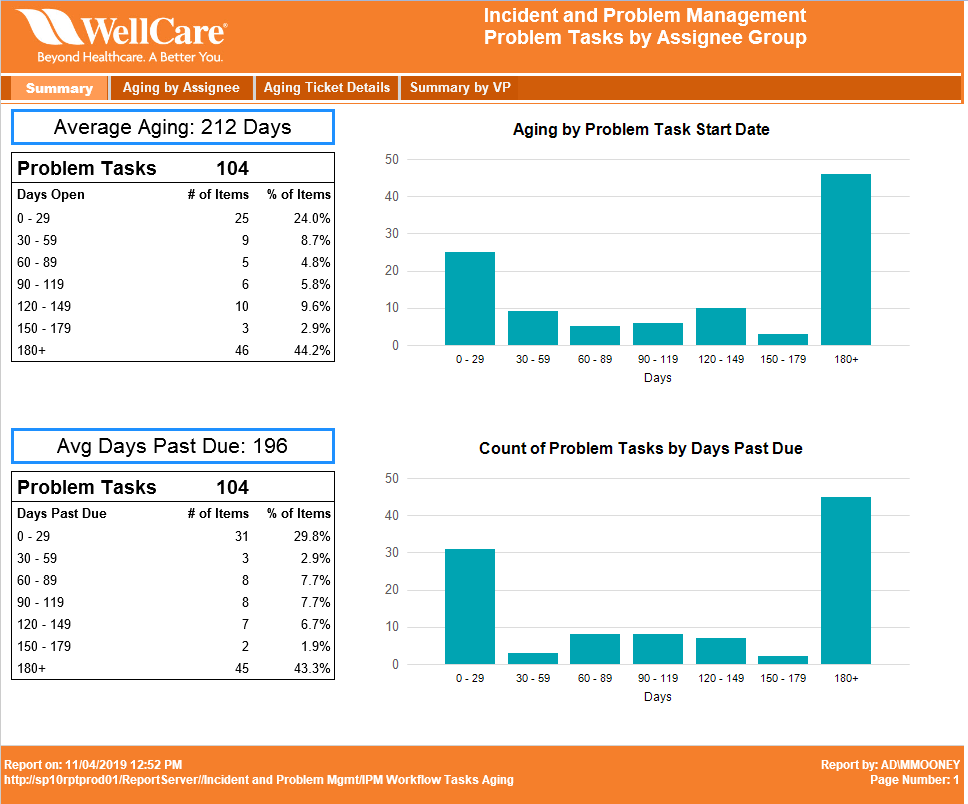
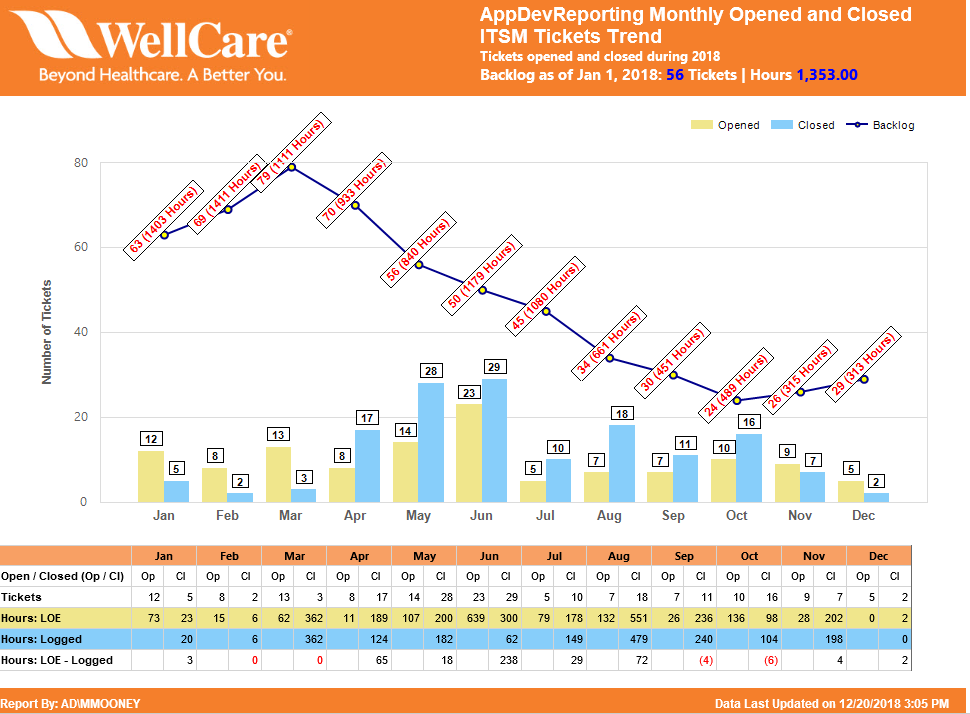
A common question for IT service desks is how many tickets are outstanding and how many hours of work does that represent.
We need more members, but I don’t know how many I have.
Mary g.
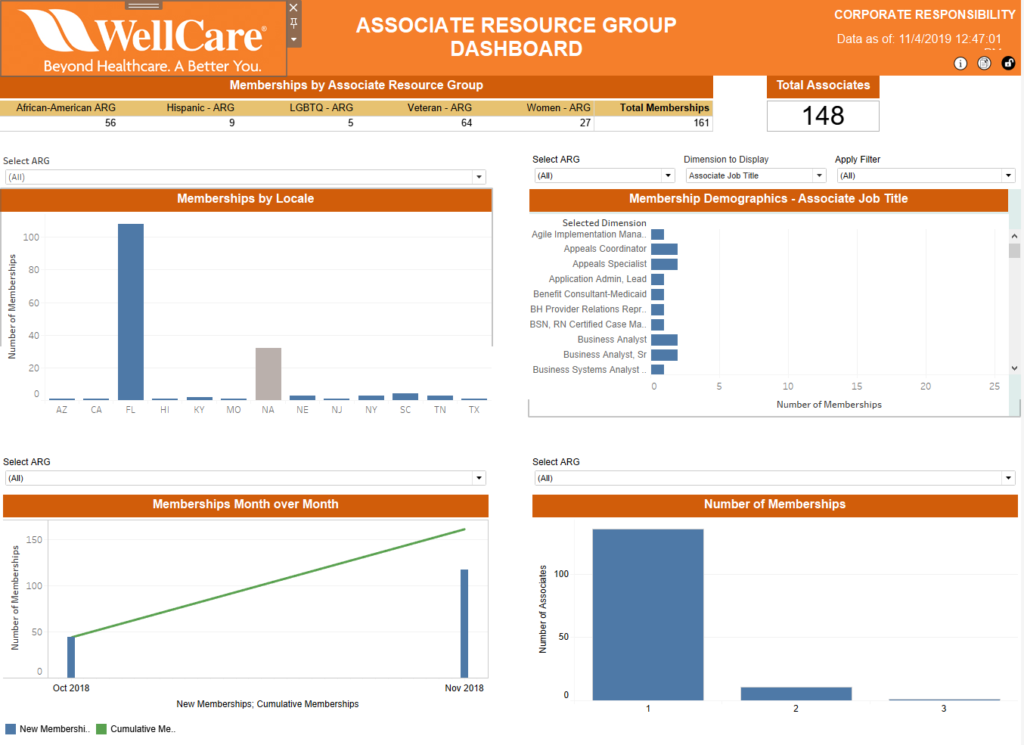
The dashboard shows the number of members for each of the Employee Resource Groups
One of the key issues facing film production companies is, will the production company make a profit from a movie. It is assumed that favorable audience reviews will in-turn lead to higher ticket sales or DVD sales, both items directly affect a movie’s profitability.
The analysis will look at what attributes lead to a higher average audience review score on the public website, Rotten Tomatoes
Spoiler Alert The analysis creates a model that is close, but isn’t 100% confident.
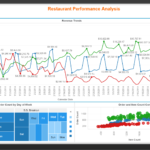
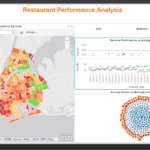
Over the last year, the three New York locations of fast-food restaurant Blazin’ Burger have
produced mixed financial results.
Below is a presentation-ready dashboard that will show
Below are dashboards created using MicroStrategy.
Updated: 2021-10-02 for R version 4.1
There are four R packages you will need to be able to post an Rmd file to WordPress. Yes there are alternatives you can generate the HTML yourself and copy and paste things, but why would you want to do it?
Powered by WordPress & Theme by Anders Norén